
26 October: our speed table was timing a cache, plus three releases and a newsletter that travels
Today’s lead is a correction to numbers our own tool produced. It’s followed by three releases, and a change to how this newsletter reaches you.
In this issue:
Our speed table was timing a cache
Section titled “Our speed table was timing a cache”interlock picks a model, an engine and a device for a job from speeds it has measured. To measure rented cards, it runs a generate ladder: the same model at prompt lengths from 512 to 32,768 tokens, with one, four and eight requests at a time, recording how long the first token takes and how fast the rest come.
Before spending real money on a full sweep, we ran short trial rungs on Colab’s cheapest card, a T4. Three of them found five problems, and every one was in our measurement, not in the card.
Rung 1: a prompt that looped
Section titled “Rung 1: a prompt that looped”The ladder built its prompt by repeating one word. One model, phi3.5, kept repeating it until Ollama stopped the run, so some cells timed a loop instead of an answer. The errors were also filed under the wrong label. interlock 1.0.5 builds a varied prompt, calibrated to the length asked for, and gives an unmeasured cell its own label so it can never read as a speed.
Rung 2: cut in half, cached, and queued
Section titled “Rung 2: cut in half, cached, and queued”The second rung found three problems at once, all confirmed in Ollama’s own source:
- Long prompts were cut in half. The prompt landed about 1% over its target, the window left no room for that, and Ollama halved the prompt at 16k and 32k tokens. Those cells came back unmeasured.
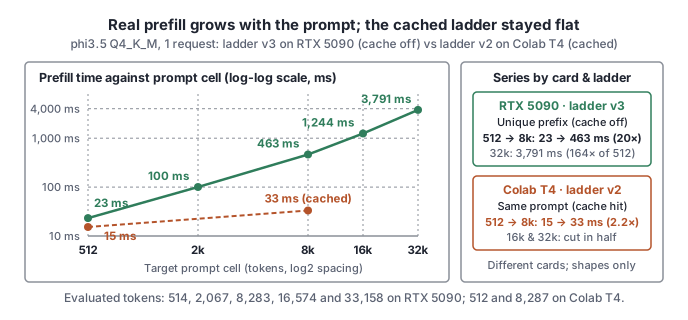
- The first token came from a cache. Ollama keeps the start of the last prompt, and the ladder sent the same prompt for its check call, its warm-up and every timed run. So each timed run read a remembered prompt: 15 ms at 512 tokens and 33 ms at 8,192, which is too fast to be real.
- Requests queued instead of running together. Ollama serves one request at a time unless told otherwise. The ladder sent four or eight at once, they waited in line, and the way it added up their speeds left out the wait. So “four at once” read close to four times one stream.
interlock 1.0.6 fixes all three. Each timed call begins with a short prefix of its own, so nothing is cached. The server gets as many slots as the cell has requests. And combined speed is total tokens over the pass’s decode window, from the first decode start to the last finish. A prompt-read time that doesn’t grow with the prompt now counts as unmeasured.
We check every change on our own machine first, where a run costs nothing. Measured that way there (on an RTX 5090), the time to read the prompt grows as it should: 23 ms at 512 tokens, 100 ms at 2k, 463 ms at 8k, 1,244 ms at 16k and 3,791 ms at 32k.
Rung 3: out of room, mislabelled
Section titled “Rung 3: out of room, mislabelled”On the fixed ladder, some long, busy cells ran out of room. Part of the model didn’t fit on the card and ran on the processor until the request timed out, or the machine’s memory filled and the run was killed. Those are honest “too big for this card” results, but they were recorded as a timeout or as unmeasured. interlock 1.0.7 reads the load from Ollama’s log before any timed call, records those cells as out of memory, and scales each cell’s timeout from a calibration call of its own.
What’s still valid, and the correction
Section titled “What’s still valid, and the correction”The speed of one stream of tokens and the largest context each card holds were not affected; the embedding throughput runs on a different path and wasn’t part of these defects. Rows from 1.0.4 and earlier also overstate their prompt length about twice over, so their one-stream speeds belong to a prompt about half as long as labelled. The first-token times and the speeds with more than one request at a time, from 1.0.5 and earlier, were not valid measures. interlock no longer uses them, and its README and handbook carry a correction notice.
The trial runs so far, three on a CPU and four on the T4, cost about 1.3 of the 800 units set aside for this sweep. With the real timings, the whole sweep is now priced at about 328 to 347 units.
Three proof products ship
Section titled “Three proof products ship”On 25 October, each of the studio’s three proof products had a release:
- Attestia 2.1.3 cleared every open advisory in its production dependencies by upgrading them, and its chain observer now stops with a clear error when a chain returns an integer too large to hold exactly. (2.1.2, earlier the same day, carried issue 30’s crash fix.)
- RepoMesh 2.5.0 adds a required test gate on every change, and its anchor posting stays on the test network: it won’t connect unless the network is testnet and the server is a known testnet server.
- Cognate 1.0.0 reaches 1.0. Every write to its server is signed with the caller’s own key, checked for its time and for replay, and recorded under the signer’s name; every route acts only in the signer’s tenant; and decisions cite the evaluations they rest on. From 1.0, a breaking change to its API or formats means a new major version.
The newsletter learns to travel
Section titled “The newsletter learns to travel”From issue 30 on, every issue publishes itself to four more places as soon as it’s live on the site:
| Where | What you get |
|---|---|
| Hugging Face: mcp-tool-shop/rnd-newsletter | every issue as a dataset row and a Markdown page |
npm: @rnd-news/newsletter |
the issues as JSON and Markdown |
PyPI: mcptoolshop-rnd-newsletter |
rnd_newsletter.latest(), issue(n) and issues() |
| GitHub releases | one per issue, with the issue attached |
All four are built from the same published files as the site. A run with nothing new publishes nothing, and a correction to an issue already out becomes a new revision, not a silent change.
Get each issue by email or RSS: Subscribe